06 – User manual
How to use the load cell display: what the screen shows, what every button does and what to do when something looks wrong. It covers the whole function of the system from the load cell to the touch screen.
About the pictures
The screen pictures in this manual are renderings drawn from the firmware's
screen layout (src/ui_screen.cpp: same geometry, colours and texts), not
photographs of the display. They are generated by
tools/render_hmi_screens.py (see section 11).
Values in the pictures (87.4 kg and so on) are examples. Items that are not yet
verified on the real board are tracked as open items (Ö…) in
03 – Check list.
1. What the system does
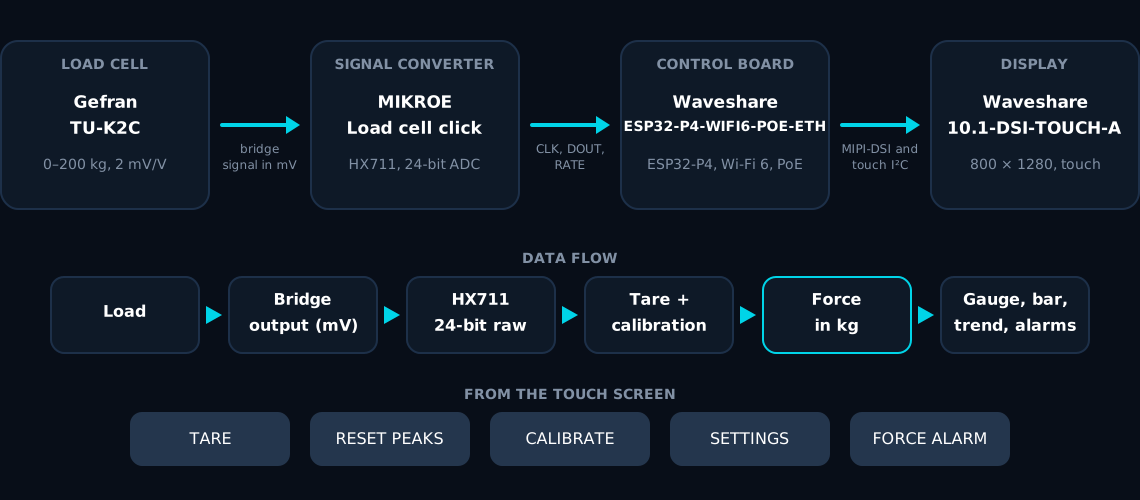
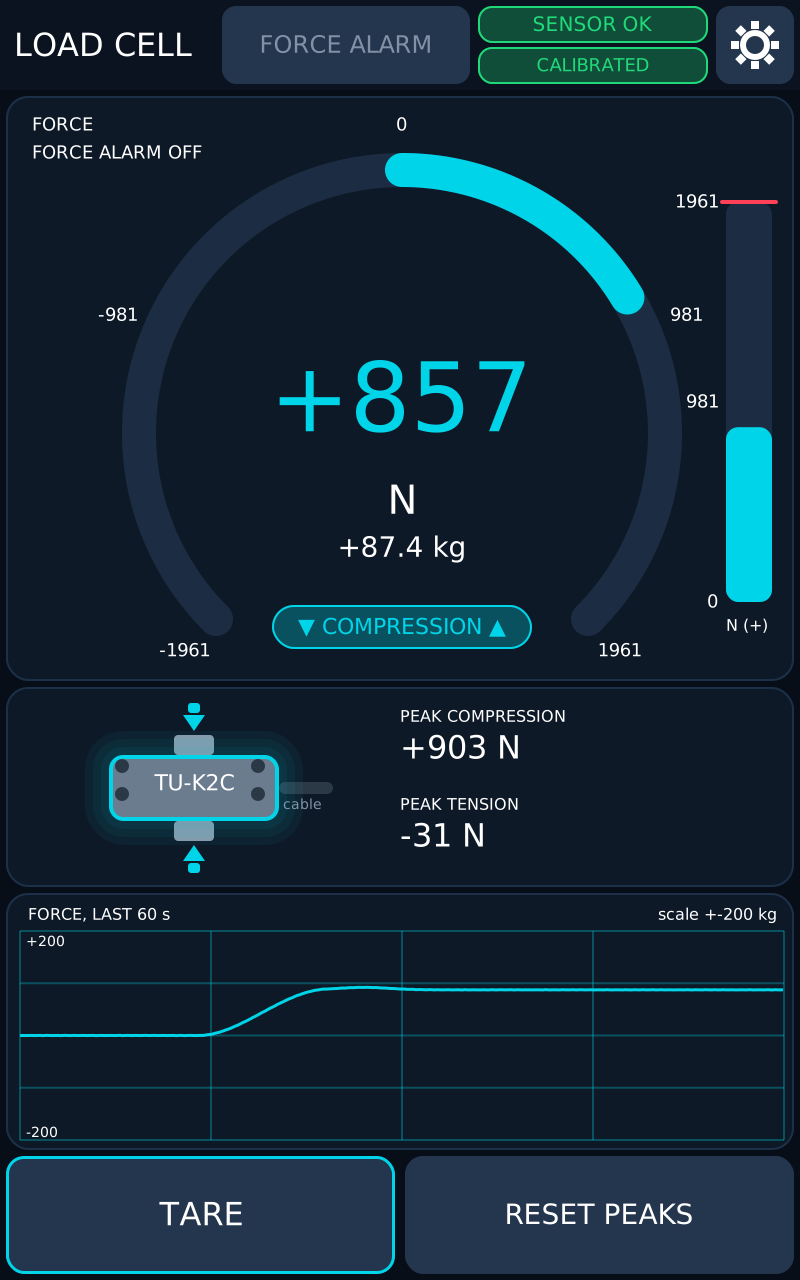
A load cell measures a force, the signal converter turns it into a number, the control board calculates the force in kilograms and shows it on the touch screen as a large value, a gauge, a bar, a load cell drawing and a 60-second trend.
| Part | Component | Task |
|---|---|---|
| Load cell | Gefran TU-K2C, 0–200 kg, 2 mV/V | Gives a small voltage that follows the force. Tension and compression have opposite signs |
| Signal converter | MIKROE Load cell click (HX711) | Powers the load cell and converts its voltage to a 24-bit number, 10 or 80 times per second |
| Control board | Waveshare ESP32-P4-WIFI6-POE-ETH | Reads the number, subtracts the zero (tare), applies the calibration and draws the screen |
| Display | Waveshare 10.1-DSI-TOUCH-A | Shows the result and takes your touch commands |
Details of the parts are in 02 – Component list, the wiring in Electrical drawing.
Sign convention
The screen shows compression as positive (+) and tension as negative (−). The sensor only measures kilograms; the unit on the screen (g, kg, N, kN) is a display setting.
2. The home screen
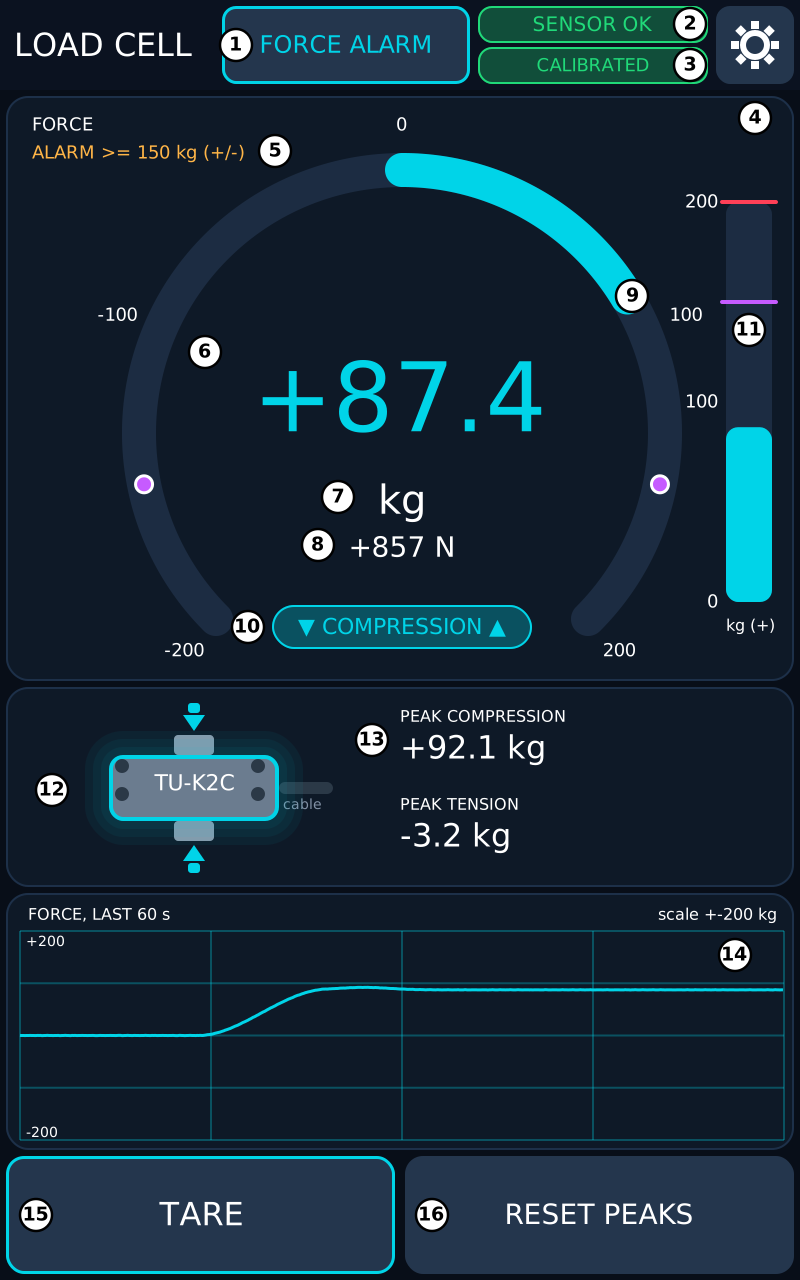
The home screen is always visible. Everything else (settings, calibration and alarms) opens as a popup on top of it.
| # | Element | What it shows or does |
|---|---|---|
| 1 | FORCE ALARM switch | Switches the optional force alarm on and off (section 7). Turquoise border and text = on, grey text = off |
| 2 | Sensor status | SENSOR OK (green), NO SIGNAL (red), INPUT OVER RANGE (red), OVERLOAD (red) or LIMIT EXCEEDED (amber). See section 5 |
| 3 | Calibration status | CALIBRATED (green) or UNCALIBRATED (amber) |
| 4 | Gear | Opens SETTINGS (section 8) |
| 5 | Alarm line | FORCE ALARM OFF, FORCE ALARM ON - set a limit or the limit, for example ALARM >= 150 kg (+/-). Amber when the alarm is armed, red when the limit is exceeded |
| 6 | Force value | The measured force, large. + is compression, - is tension. Turquoise; red above the maximum permitted force; grey --- without a signal |
| 7 | Unit | g, kg, N or kN (SETTINGS) |
| 8 | Second line | The force in the other unit family: N when the unit is g or kg, kg when the unit is N or kN |
| 9 | Gauge | 270° arc. The filled part runs from zero to the value. Scale: minimum, half, 0, half, maximum. Purple dots mark the alarm limit (± limit) |
| 10 | Mode chip | ▼ COMPRESSION ▲, ▲ TENSION ▼, NO LOAD (within ±0.05 kg) or NO SIGNAL |
| 11 | Vertical bar | The same value as the gauge, but only compression: 0 at the bottom, gauge maximum at the top. Red mark = maximum permitted force, purple mark = alarm limit |
| 12 | Load cell drawing | Shows the direction and size of the force (section 4) |
| 13 | Peak values | Largest compression and largest tension since the last reset |
| 14 | Trend | The force over the last 60 seconds. Touch and hold for a read-out (section 6) |
| 15 | TARE | Sets the present reading as zero (section 3) |
| 16 | RESET PEAKS | Clears the two peak values |
The raw ADC value and the conversion rate are not on the home screen; they are on the SIGNAL card in SETTINGS.
3. Everyday use
3.1 Start-up
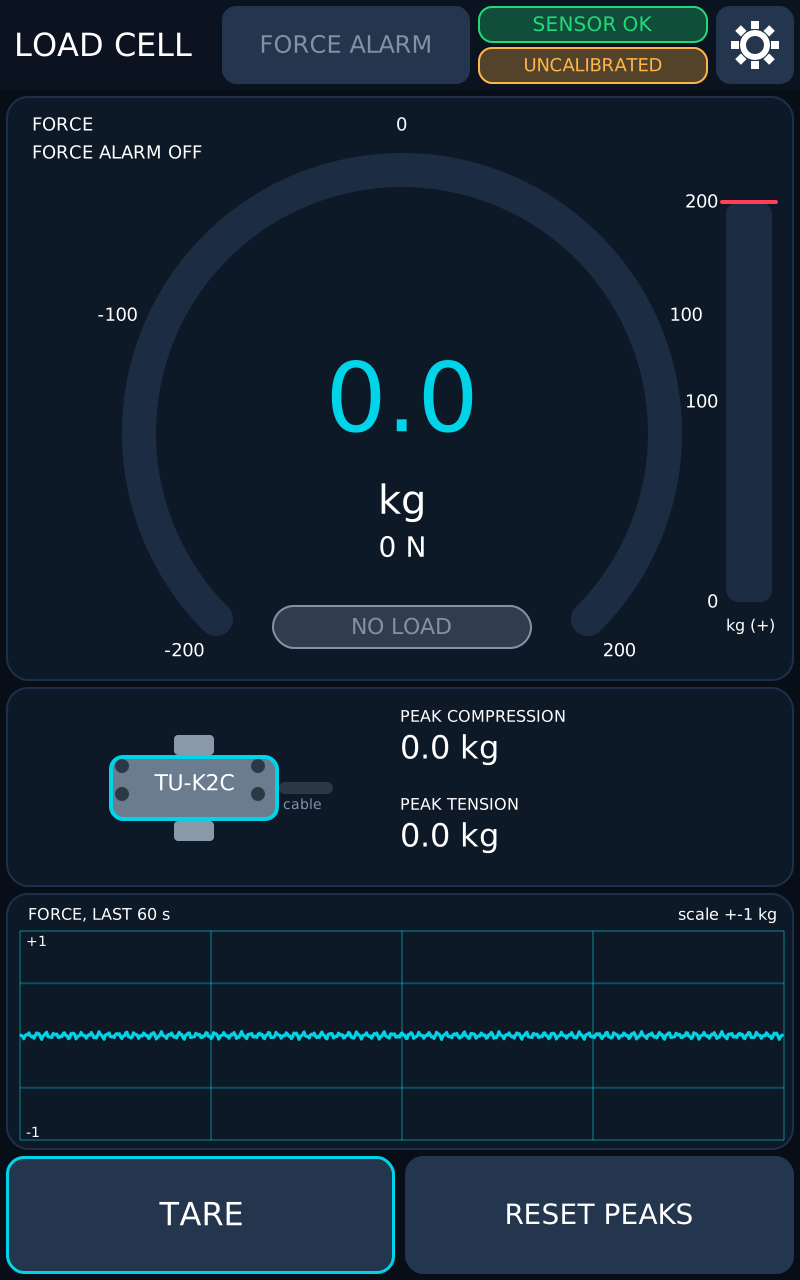
- Power the board. The screen lights up and the system judges the signal for about a second. During this time the header can show NO SIGNAL.
- Check that the header shows SENSOR OK. If not, see section 9.
- UNCALIBRATED (amber) is normal until a calibration has been run once (section 8.3). Until then the reading uses an ideal estimate of the scale (about 21 475 counts/kg for a 200 kg cell) and can be a few percent off.
3.2 Measure a load
- Make sure the load cell is unloaded and press TARE. The message Zero set appears. The zero is stored and is still there after a restart.
- Apply the load. The value, gauge, bar, drawing and trend follow.
- Read the force. Peak values keep the largest compression and tension. Press RESET PEAKS to start a new peak measurement.
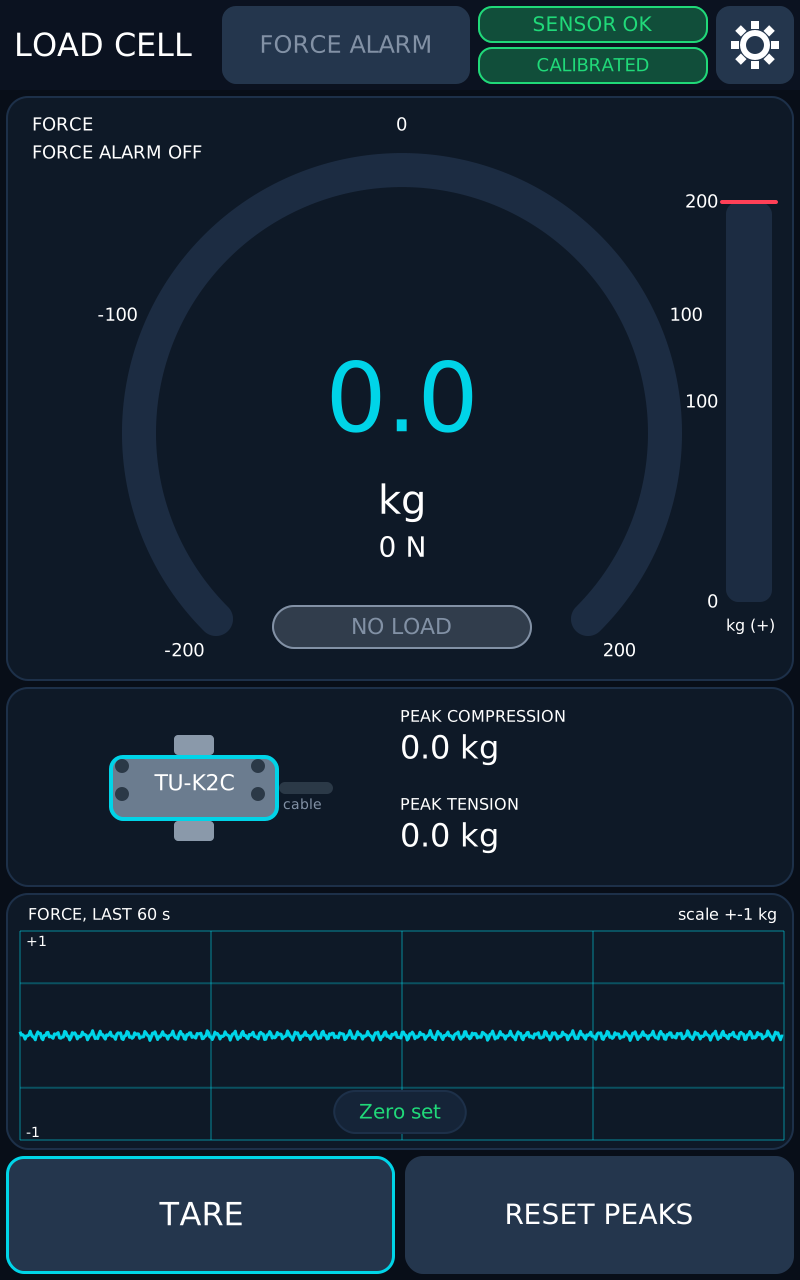
TARE also clears the peak values. It is refused (with a message) if there is no signal, or during the first second after start-up while the filter is filling.
3.3 Messages
A short message pill appears above the buttons for 3 seconds.
| Message | Colour | Meaning |
|---|---|---|
| Zero set | green | TARE succeeded |
| No signal from the HX711 | red | TARE refused, the converter does not answer |
| Filter still filling, try again in a second | amber | TARE refused, too soon after start-up |
| Peaks cleared | grey | RESET PEAKS |
| Force alarm on / Force alarm off | amber / grey | FORCE ALARM switch |
| Force alarm on. Set the alarm limit in SETTINGS. | amber | Alarm on but no limit set |
| Settings saved | green | SAVE in SETTINGS |
| Range changed. Press TARE with no load. | amber | The sensor range was changed |
| Calibrated: N counts/kg | green | Calibration succeeded |
| Factory estimate restored, zero cleared | amber | FACTORY in the calibration popup |
4. Reading the display
4.1 Compression, tension, no load, no signal
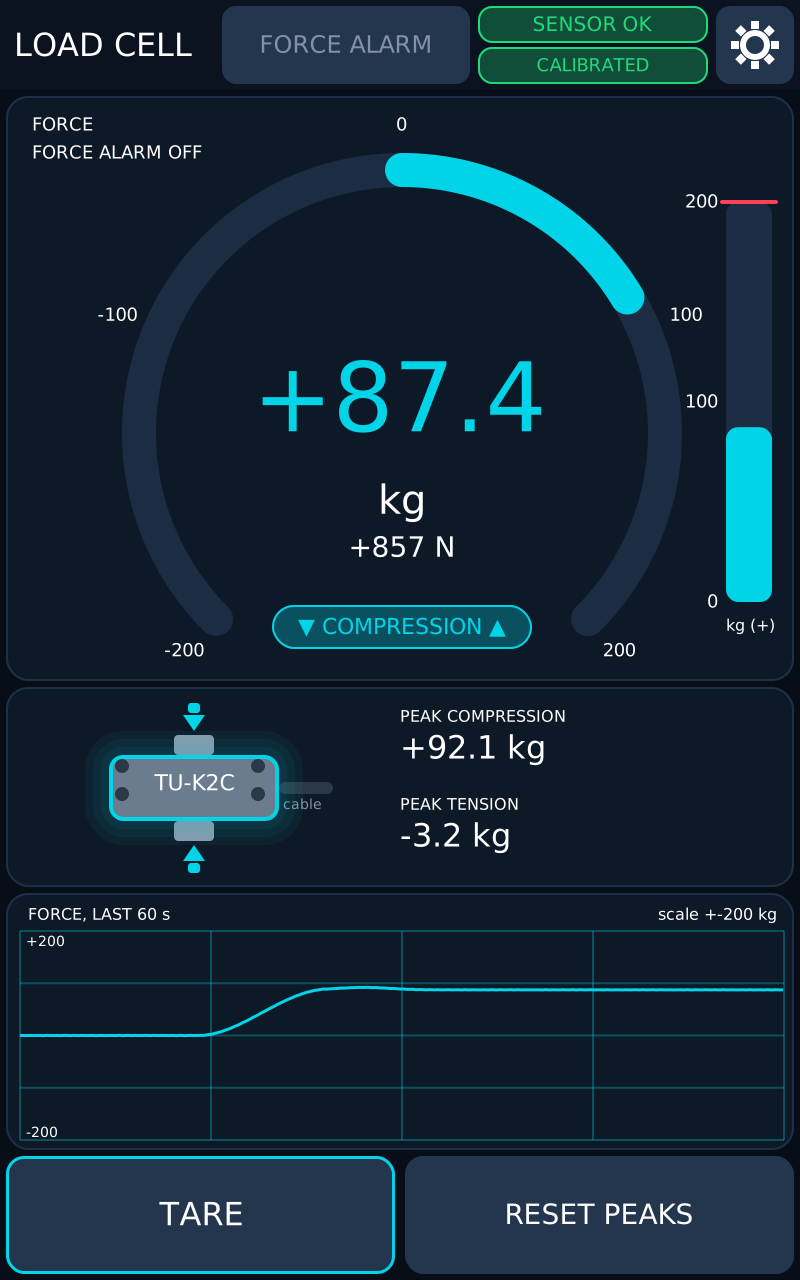
Positive values (compression) fill the gauge clockwise from the zero point at the top, and fill the vertical bar. The mode chip reads ▼ COMPRESSION ▲.
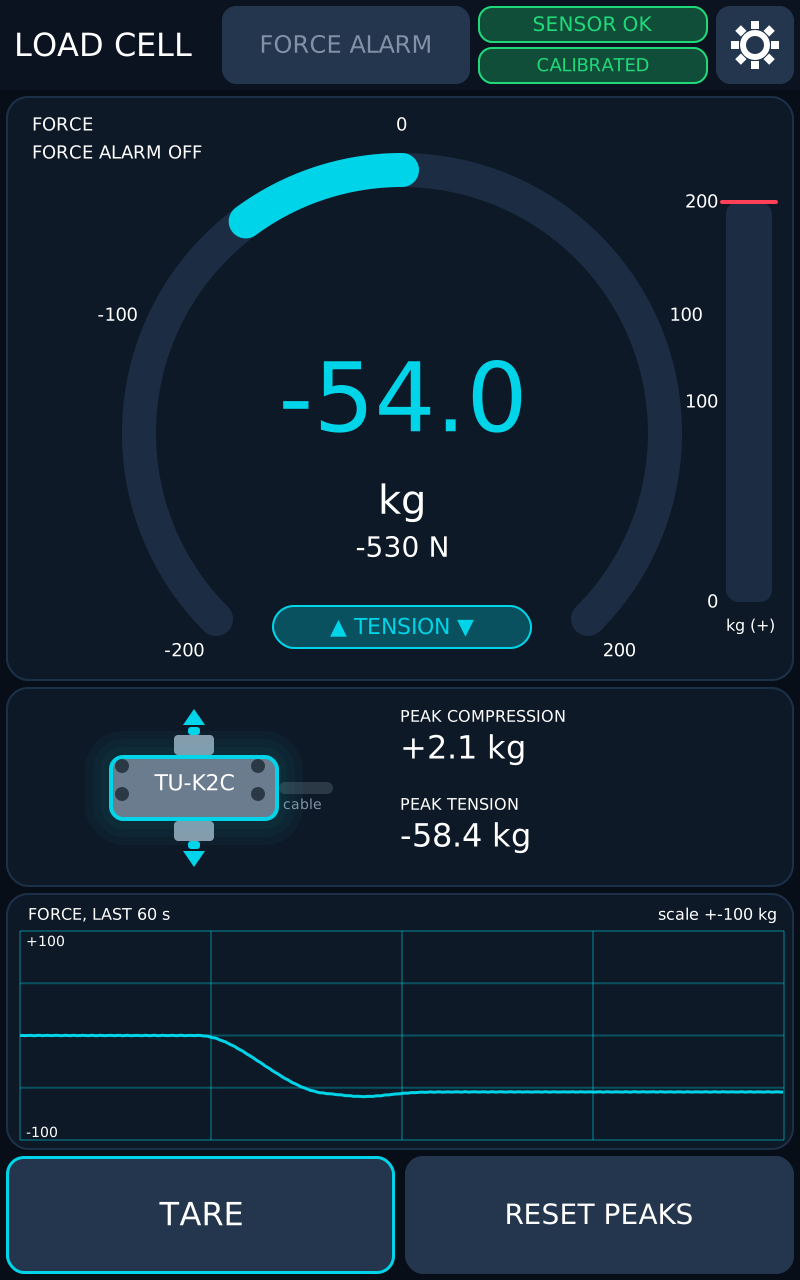
Negative values (tension) fill the gauge counter-clockwise from zero. The bar only shows compression, so it stays empty. The mode chip reads ▲ TENSION ▼.
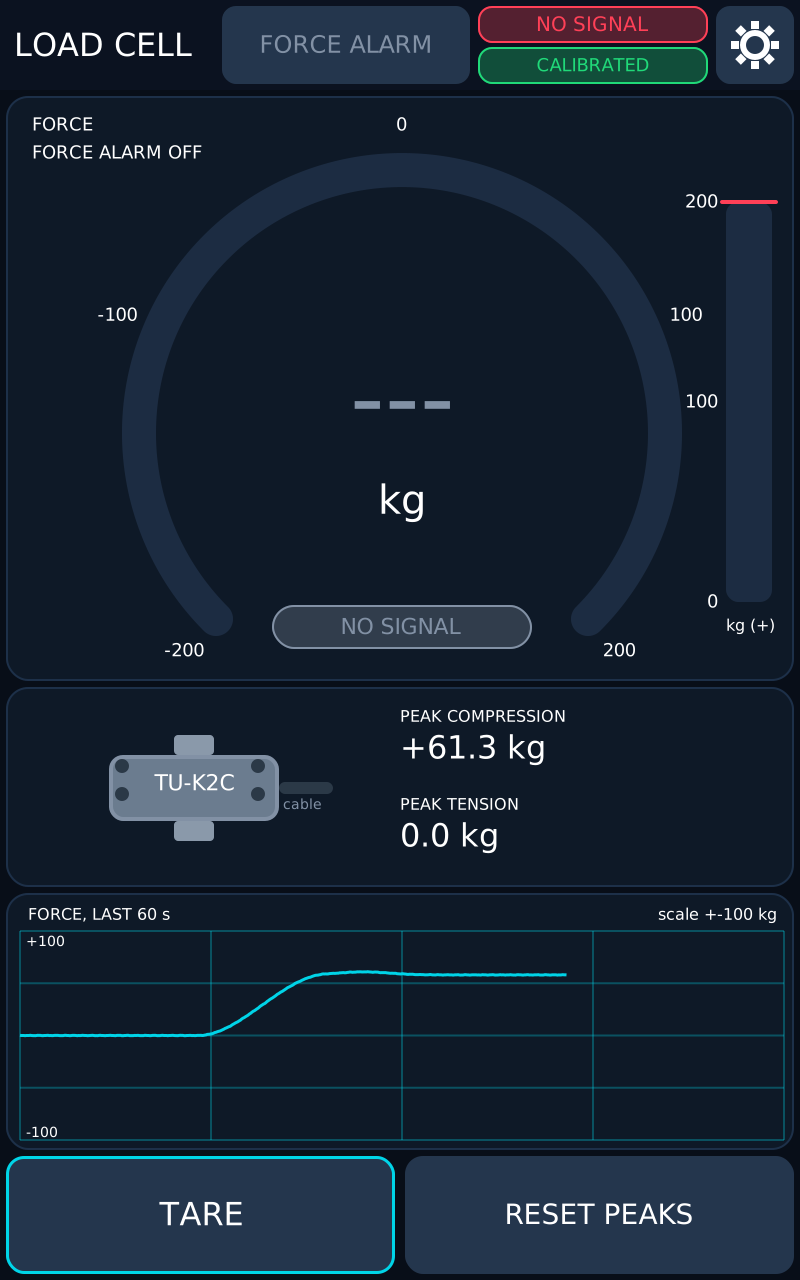
The force value is replaced by ---, the gauge and drawing turn grey and the
trend curve breaks where the signal was lost. Peak values keep their last
values. Causes and remedies are in section 9.
4.2 The load cell drawing
The drawing shows the load cell from the side, with a stud at each end and the cable on the right.
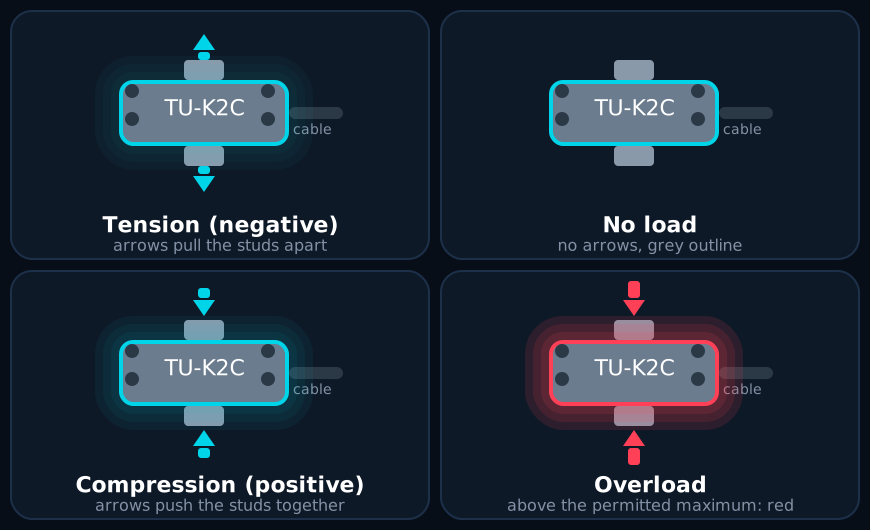
- Tension: the load cell is pulled, the arrows point away from the body.
- Compression: the load cell is pushed, the arrows point towards the body.
- The arrows get longer with more force and are hidden below 0.6 kg.
- The outline and the glow follow the force colour: turquoise for a measured force, red above the maximum permitted force, grey when there is no signal or no load.
4.3 Gauge and bar
- The gauge covers the range set in SETTINGS (default −200 … +200 kg). The filled part is drawn from zero to the present value, so it also works when the range is not symmetric.
- The bar shows the same value, compression only, from 0 to the gauge maximum.
- A red mark on the bar is the maximum permitted force; a purple mark (and purple dots on the gauge) show the alarm limit when the force alarm is on.
4.4 Units
The unit is chosen in SETTINGS: g, kg, N or kN. The large value, gauge and bar scales, peak values, trend read-out, popups and the alarm text all follow it. The sensor itself always measures kilograms; N and kN are calculated with the factor Newton per kg (default 9.80665).
Values that round to zero are shown as 0, 0.0 and so on, never as -0.0.
Settings values, the calibration weight and the trend axis (scale +-N kg) are
always in kg.
4.5 Stable numbers
The last digits of the reading always move a little with electrical noise. The Stabilise setting (OFF / MED / HIGH, default MED) calms them without delaying a real load change. With 3 decimals the last digit can still move at HIGH. The alarm limits are judged on the fast value, so they are not delayed by the filter. Background: 05 – Software, section 6.6.
5. Status messages
5.1 Sensor status (header, top chip)
The chip shows the first of these that applies:
| Chip | Colour | Meaning |
|---|---|---|
| NO SIGNAL | red | The converter does not deliver a usable signal (every fault, and the first second after start) |
| INPUT OVER RANGE | red | The signal is outside what the converter can measure |
| OVERLOAD | red | The force is above the maximum permitted force |
| LIMIT EXCEEDED | amber | The force is at or above the alarm limit (force alarm on) |
| SENSOR OK | green | Normal |
5.2 Calibration status (header, bottom chip)
CALIBRATED (green) after a successful calibration, UNCALIBRATED (amber) before it, after FACTORY and after the sensor range has been changed.
6. Trend and touch read-out
The trend shows the last 60 seconds, one point every 100 ms, with positive
(compression) up and zero on the middle grid line. The vertical scale
(scale +-N kg) steps through ±1, 2, 5, 10, 20, 50, 100, 200, 500, 1000 and
2000 kg and is chosen so that the curve fits.
Touch and hold a finger on the chart to read a value:
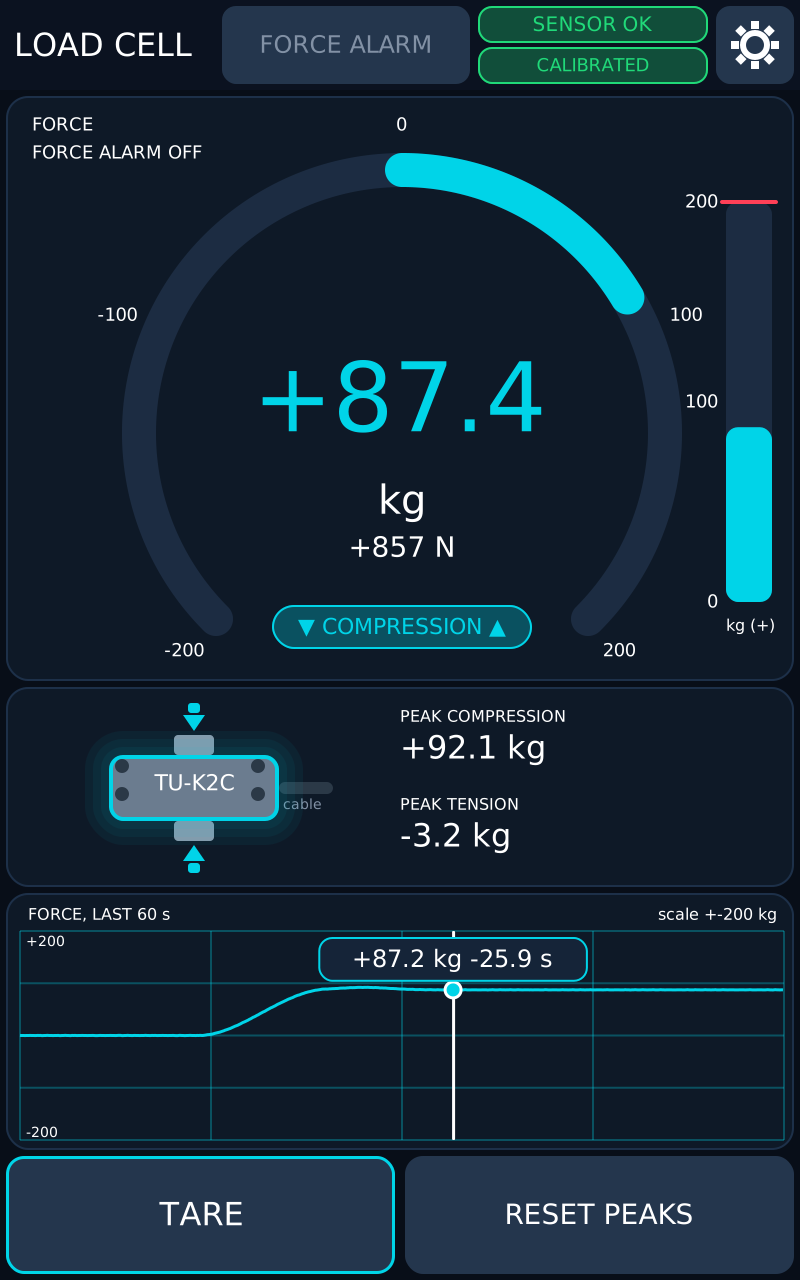
A white vertical line follows the finger, a turquoise dot marks the point on the
curve, and a bubble shows the value in the chosen unit and its age, for example
+87.2 kg -25.9 s. It reads no signal where the sensor was offline. Everything
disappears when you lift the finger.
7. Alarms
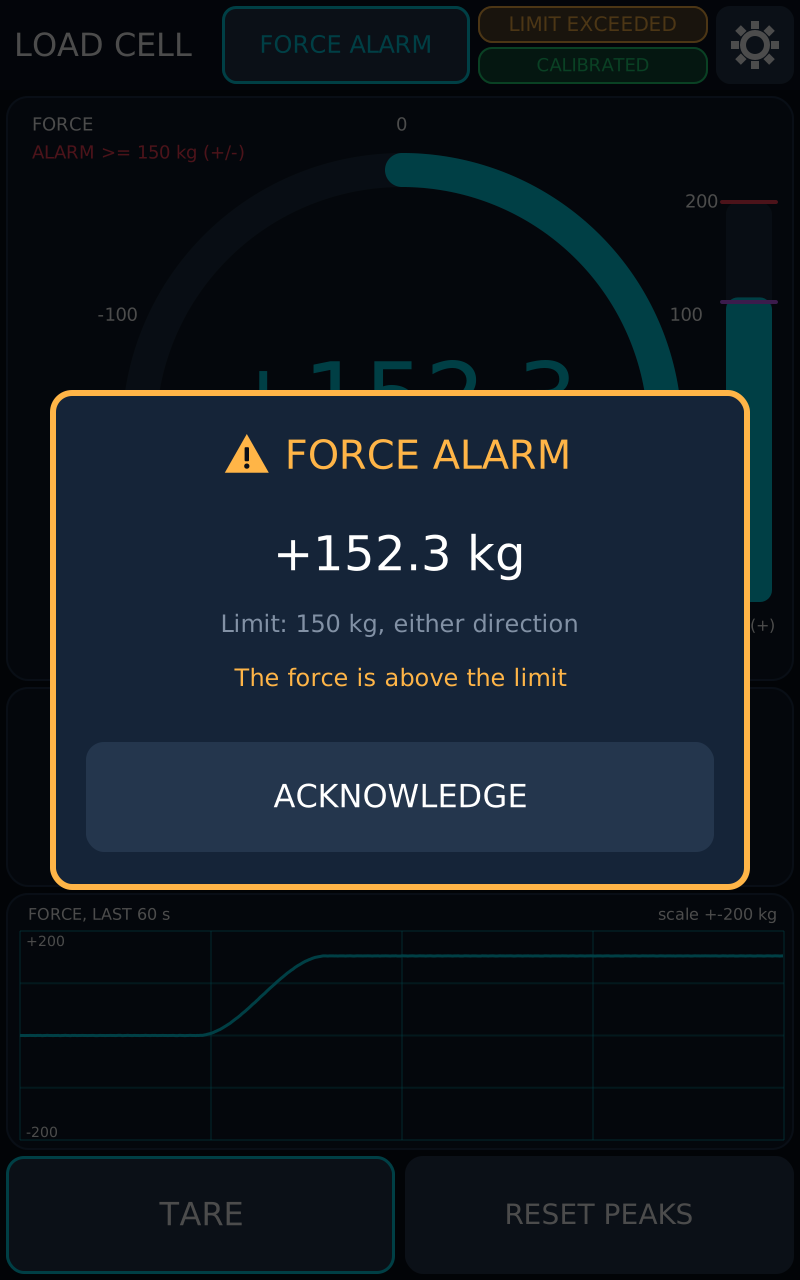
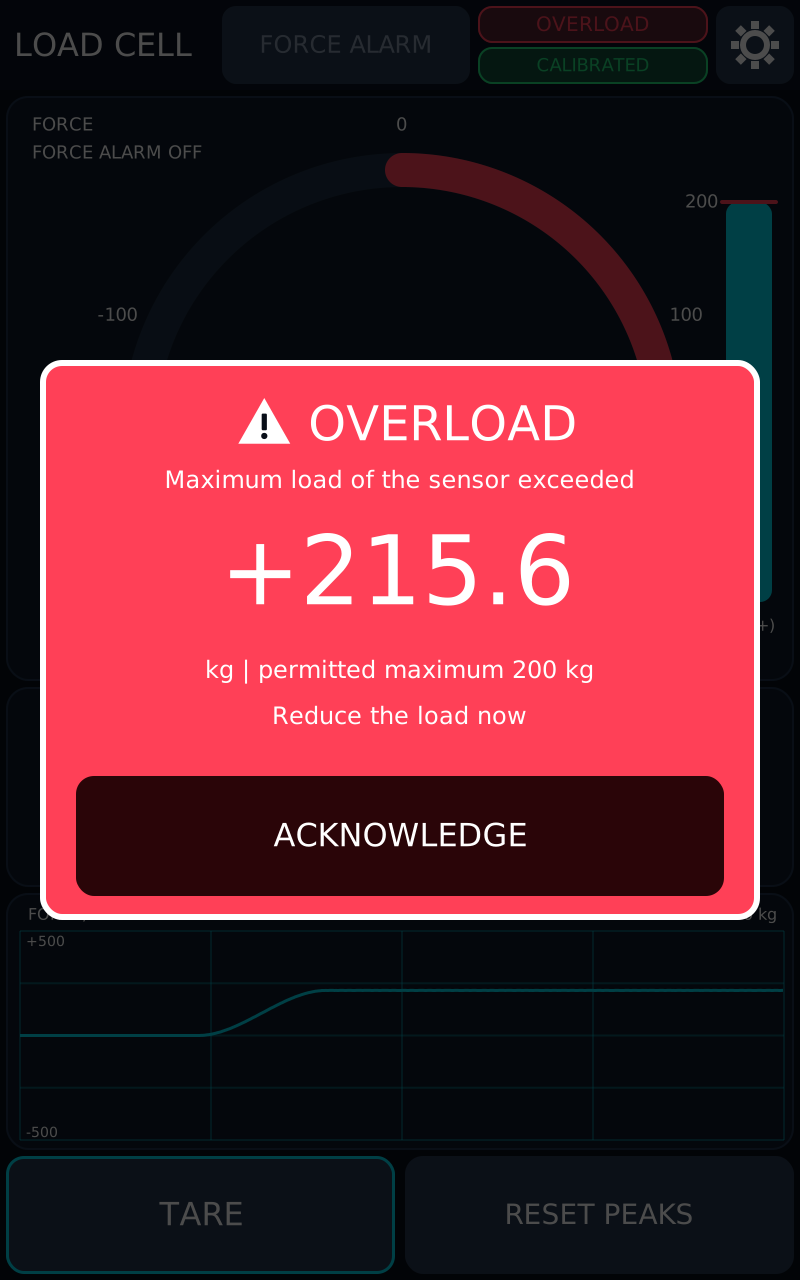
There are two alarms. Both open a popup on top of everything, dim the screen behind it and block touches until you press ACKNOWLEDGE.
| Force alarm | Overload | |
|---|---|---|
| Purpose | Your own warning limit | Protects the load cell |
| On/off | FORCE ALARM switch (header) | Always on |
| Limit | Alarm limit in SETTINGS (0 = not set) | Max permitted force in SETTINGS (default = sensor range) |
| Triggers when | size of the force ≥ limit, either direction | size of the force > max permitted force |
| Popup | Amber, steady | Red, flashing (bright and dark red every 0.35 s) |
| Header chip | LIMIT EXCEEDED (amber) | OVERLOAD (red) |
How the popups behave
- The popup shows the live force while it is open and tells you when the force is back below the limit.
- It is latched: it stays until you press ACKNOWLEDGE.
- After acknowledging, it opens again only when the force has first dropped below the limit (with a small margin: the larger of 0.2 kg and 5 % of the limit) and then exceeds it again.
- Changing a limit, or switching the force alarm off and on, arms the alarm again.
- Nothing is raised while there is no signal.
- When the force alarm is on, purple markers on the gauge and bar show the limit.
Overload
The permitted static load of the Gefran TU-K2C is 130 % of the rated load, and the rupture load is above 300 %. The OVERLOAD popup is only a warning, it does not protect the cell. Reduce the load at once.
8. Settings
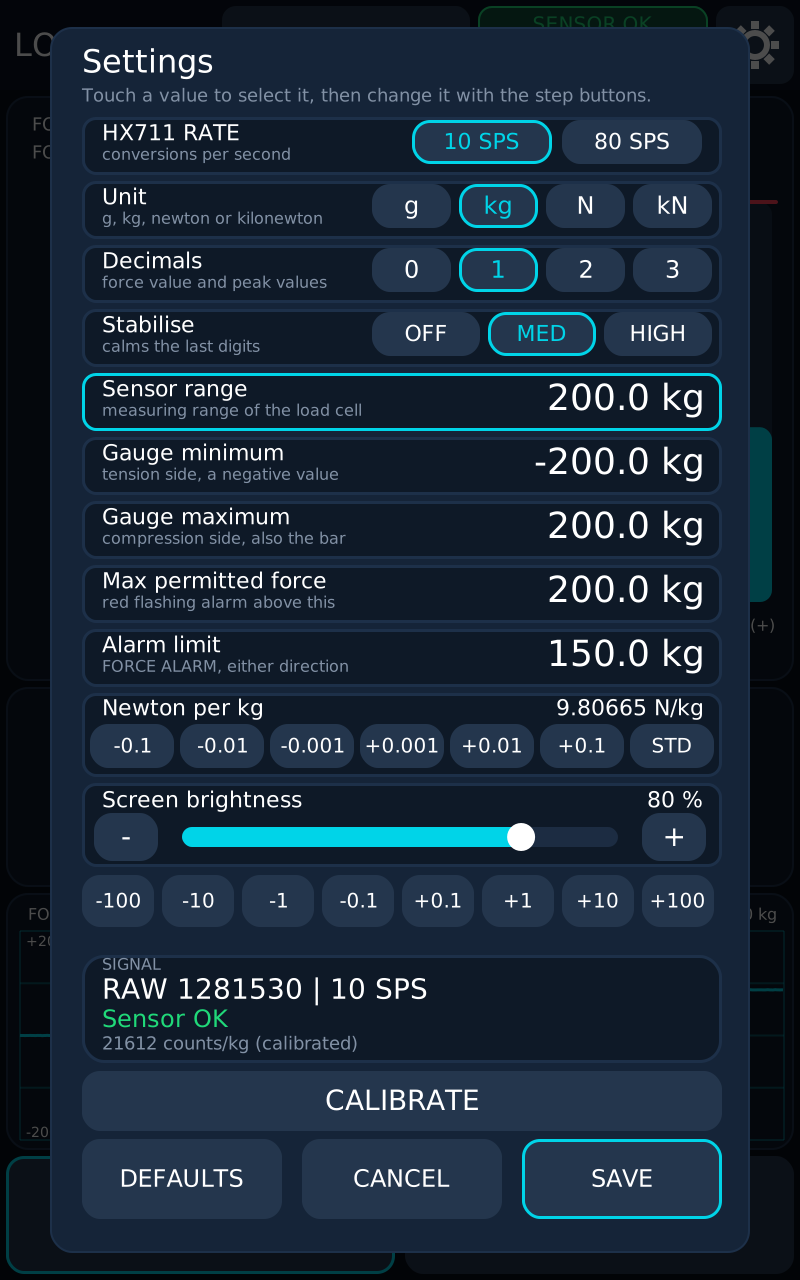
Open SETTINGS with the gear (4). Touch a value to select it (turquoise border), then change it with the step buttons. Nothing is changed for good until you press SAVE.
8.1 What you can set
| Setting | Range | Meaning |
|---|---|---|
| HX711 RATE | 10 / 80 SPS | Conversions per second. 10 SPS is calmer, 80 SPS reacts faster. Restarts the converter |
| Unit | g / kg / N / kN | Unit of everything shown (section 4.4). Default kg |
| Decimals | 0 / 1 / 2 / 3 | Decimals of the force value, peak values, popups and trend read-out. Default 1 |
| Stabilise | OFF / MED / HIGH | Calms the last digits (section 4.5). Default MED |
| Sensor range | 0.1 … 2000 kg | Measuring range of the connected load cell. Default 200 kg (Gefran TU-K2C) |
| Gauge minimum | −1.3 × range … 0 | Tension end of the gauge |
| Gauge maximum | 1 kg … 1.3 × range | Compression end of the gauge, also the top of the bar |
| Max permitted force | 1 kg … 1.3 × range | Overload limit (section 7). Default = sensor range |
| Alarm limit | 0 … 1.3 × range | Force alarm limit. 0 = not set |
| Newton per kg | 1.00000 … 20.00000 | Factor for N and kN. STD restores 9.80665 |
| Screen brightness | 10 … 100 % | Slider or − / +. Changes at once; SAVE keeps it, CANCEL restores the old value. It cannot go below 10 %, so the screen cannot be switched off by mistake |
Step buttons for the values in kg: −100, −10, −1, −0.1, +0.1, +1, +10, +100.
Changing the sensor range
A new range means another load cell. SAVE then resets the gauge and the maximum force to the new range and clears the tare and the calibration (the header turns UNCALIBRATED). Press TARE with no load afterwards and calibrate again.
8.2 SIGNAL card
The SIGNAL card shows live diagnostics while the page is open: the raw
converter value (RAW), the measured conversions per second, the sensor status
text and the scale (counts/kg, marked calibrated or factory estimate).
8.3 Calibration
Calibration makes the reading match a real, known weight. Run it once for each load cell, and again if the readings look wrong. Open it with CALIBRATE at the bottom of the settings page.
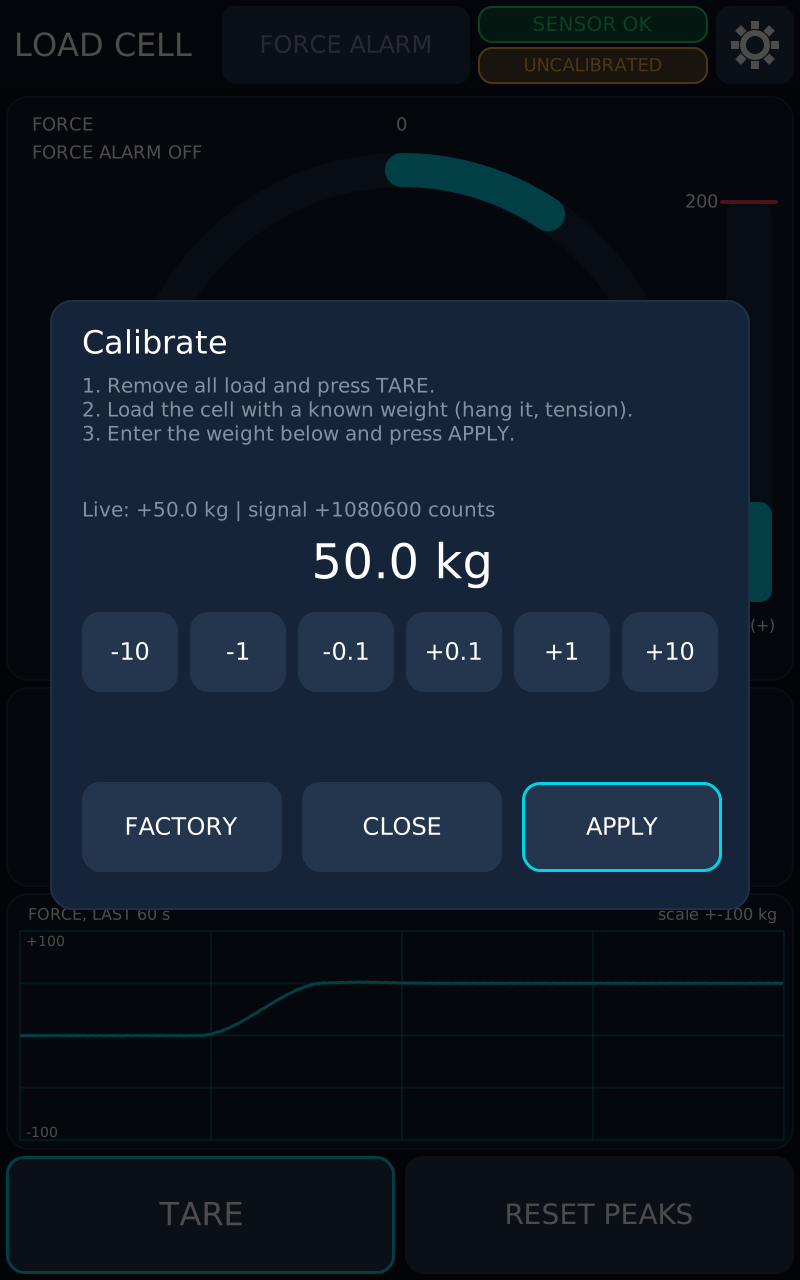
- Remove all load and press TARE.
- Load the cell with a known weight. The popup text says to hang the weight in tension; the calibration uses the size of the signal, so the direction does not matter (05 – Software, section 6.4).
- Open CALIBRATE and enter the weight with the step buttons (−10, −1, −0.1, +0.1, +1, +10 kg). The Live line shows the present force and signal.
- Press APPLY. The message Calibrated: … counts/kg confirms it and the header turns CALIBRATED.
| Button | Does |
|---|---|
| APPLY | Stores the scale from the entered weight |
| FACTORY | Goes back to the factory estimate and clears the zero |
| CLOSE | Closes the popup without changes |
APPLY is refused with a red message if there is no signal (No signal from the HX711.) or the signal is too small, meaning the weight is not on the cell (Signal too small. Load the cell with the weight first.). The weight must be at least 1 kg. After calibrating, check with a second known weight.
8.4 Buttons on the settings page
| Button | Does |
|---|---|
| SAVE | Stores all settings and closes the page. Refused if the gauge spans less than 1.0 kg |
| CANCEL | Discards the changes and restores the brightness |
| DEFAULTS | Sets range 200 kg, gauge ±200 kg, max force 200 kg, alarm limit not set, unit kg, 9.80665 N/kg and the default rate |
8.5 What is remembered
| What | Saved when | Kept after a restart |
|---|---|---|
| Zero (tare) and calibration | TARE / APPLY / FACTORY | Yes |
| Rate, sensor range, stabilisation | SAVE | Yes |
| Unit, decimals, N per kg, gauge, limits | SAVE | Yes |
| FORCE ALARM on/off | When you press the switch | Yes |
| Brightness | SAVE | Yes |
| Peak values and the trend | – | No, they start empty |
9. Troubleshooting
| What you see | Likely cause | What to do |
|---|---|---|
| NO SIGNAL after start-up | The converter does not answer | Open SETTINGS and read the SIGNAL card (table below). Check power and the three signal wires CLK, DOUT, RATE (Electrical drawing) |
| INPUT OVER RANGE | The converter input is saturated | Remove the load. Check the load cell wiring and polarity |
| Pushing the cell gives a negative value | Wire polarity not verified yet (open item Ö1) | Swap the signal wires, or set LOAD_CELL_INVERT_SIGN in include/load_cell_config.h and rebuild. Record which one in the check list |
| UNCALIBRATED | No calibration has been run | Calibrate with a known weight (section 8.3) |
| Reading is not zero without load | Zero not set, or the cell has drifted | Press TARE with no load |
| Last digit flickers | Electrical noise | Set Stabilise to MED or HIGH, or reduce the decimals |
| Reading reacts slowly | Averaging at 10 SPS (about 0.8 s) | Try 80 SPS in SETTINGS (tested on the board, Ö8) |
| Screen too dark | Brightness set low | SETTINGS → Screen brightness (open item Ö11 covers the backlight path) |
| Touch does not respond | Touch controller or driver (open item Ö10) | Check the TouchPad_ID line on the serial monitor at 115200 baud |
| Values look wrong after changing the range | The range change cleared tare and calibration | TARE with no load, then calibrate |
Sensor status text on the SIGNAL card
| Text | Meaning |
|---|---|
| Sensor OK | Normal |
| Starting, judging the signal | The first second after start or restart |
| No conversions from the HX711 | Nothing arrived for 1.5 s: check supply and wiring |
| Conversion rate is wrong | The rate is far from 10 or 80 per second: the line may be floating |
| Value never changes | The same number again and again: no real converter |
| DOUT stuck low, no HX711 answering | The data line is held low: check DOUT, the converter supply and the logic level (open item Ö4) |
10. Technical summary
| Item | Value |
|---|---|
| Load cell | Gefran TU-K2C, 0–200 kg, class 0.2 %, 2 mV/V, 350 Ω, IP67 |
| Converter | HX711, 24 bit, channel A gain 128, 10 or 80 SPS |
| Averaging | 8 conversions, then the Stabilise filter |
| Display | 10.1" IPS, 800 × 1280, capacitive touch |
| Units | g, kg, N, kN (sensor measures kg) |
| Trend | 60 s, 600 points, 100 ms per point |
| Peak values | Largest compression and tension since the last reset |
| Serial monitor | 115200 baud (diagnostics for service) |
Full component data: 02 – Component list. Firmware and formulas: 05 – Software.
11. About the pictures
The screen pictures are generated, not photographed, so they always match the
layout in the source code but not necessarily every pixel of the real display
(fonts and anti-aliasing differ). To regenerate them after a change in
src/ui_screen.cpp:
The script uses only the Python standard library and writes the SVG files to
docs/images/hmi/. If the layout or a text in ui_screen.cpp changes, change the
script and this manual in the same commit.